User Interface
Welcome Page
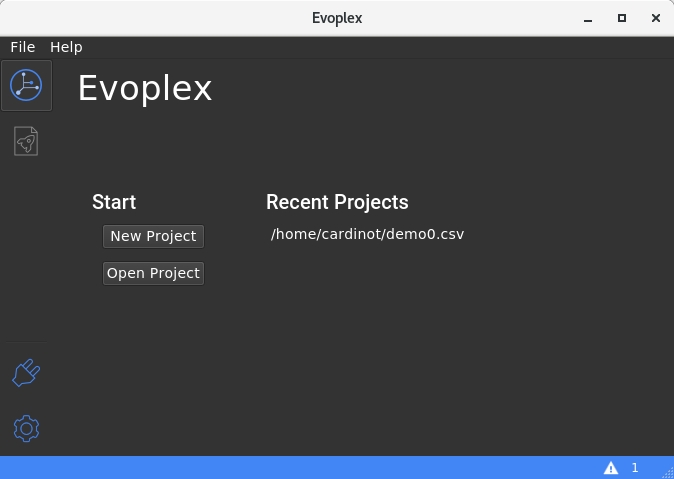
When you open Evoplex, you will be greeted by the welcome view. Your recent projects will be listed here.
Project Page
When you create or open a project, you will be redirected to the Project Page, which can hold three types of widgets: Project View, Experiment Designer and Experiment View. This page allows you to open several widgets at the same time. Notice that all widgets can be detached from the main window by clicking on the "^" button on the top of the widgets.
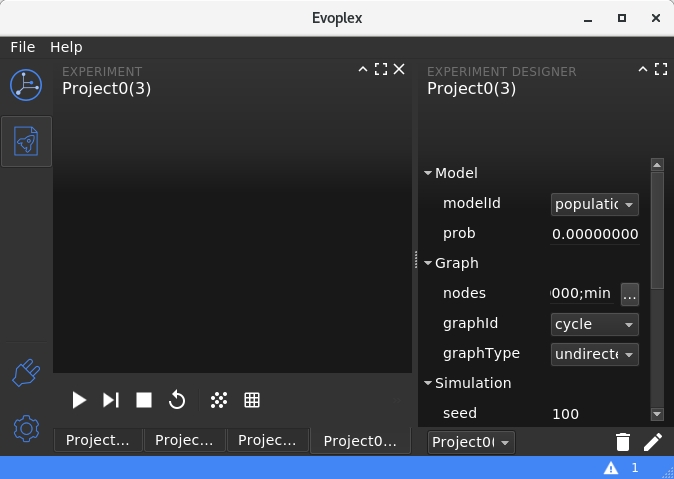
Experiment Designer
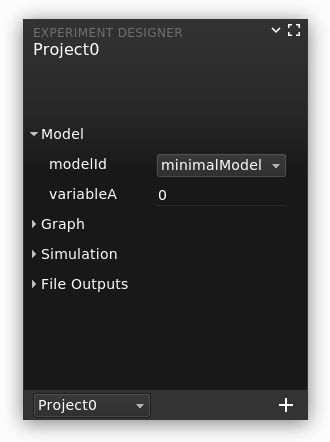
This tool allows you to add, edit and remove experiments in your project. By default, this tool appears beside the Project View and the Experiment View, but you are allowed to detach from the main window and/or drag and drop to another position.
Project View
This view has a table to list all the experiments within the project. The experiments can be executed and paused directly from the table as shown below. Notice that you are allowed to open more than one project in parallel (see tabs in the bottom).
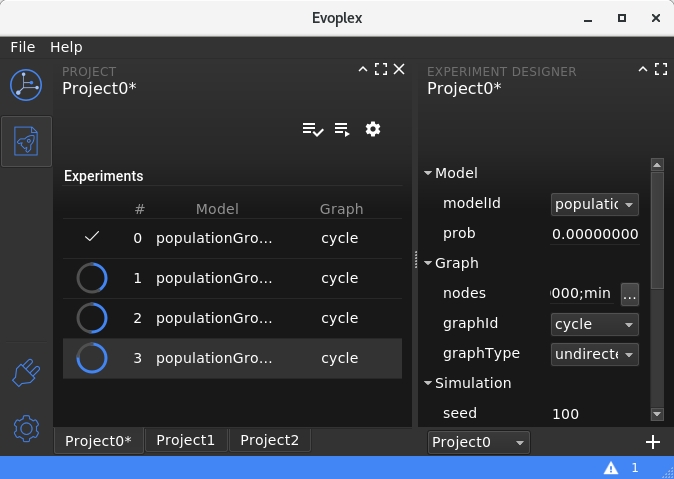
When a project is unsaved, there will be an asterisk beside its name on the tab. To save a project, go to File=>Save.
Experiment View
This view is accessed when the user double-clicks on an experiment in the table. It allows executing/pausing/resetting the experiment, and opening the visualization tools.
Visualization Tools
The Experiment View allows you to open multiple visualization tools at the same time for the same experiment.
There are two types of view:
- Graph View: which allows visualizing the nodes and edges in the graph.
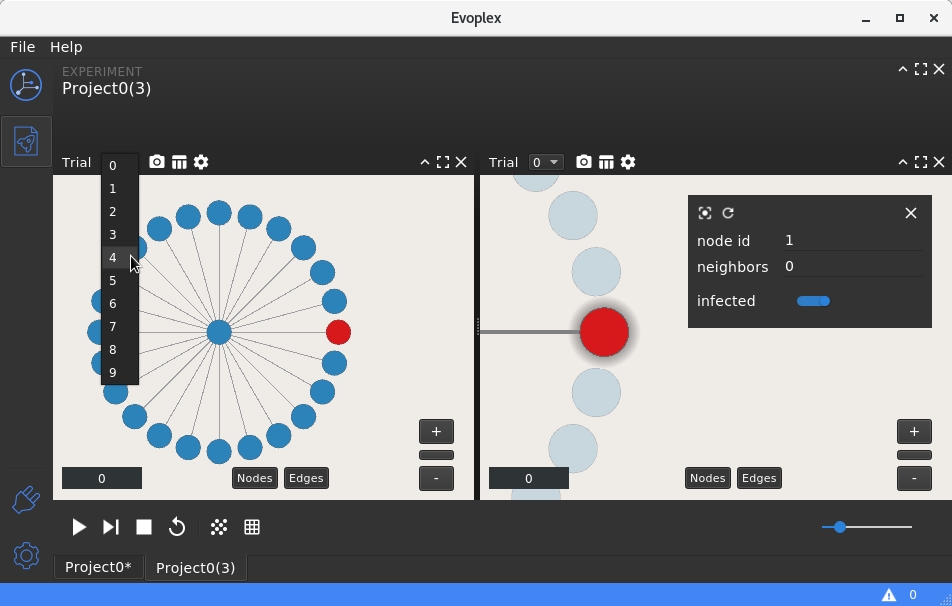
- Grid View: which shows only the nodes as cells in a grid.
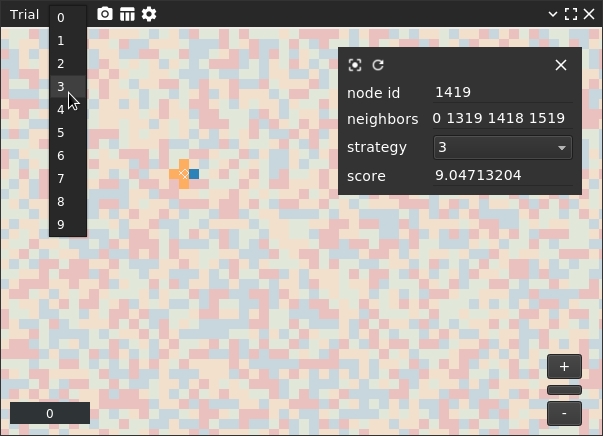
Attributes Inspector
Notice that, in both views, you can click on a node to open the Attributes Inspector, which is a tool to allow reading and editing the node's attributes.
Trials
Evoplex allows an experiment to run for a number of trials, i.e., repeat the same experiment for a number of times using different pseudo-random generator seeds. It is done by setting the "trials" field in the Experiment Designer tool.
The visualization tools have a drop-down menu to allow selecting which trial should be displayed.
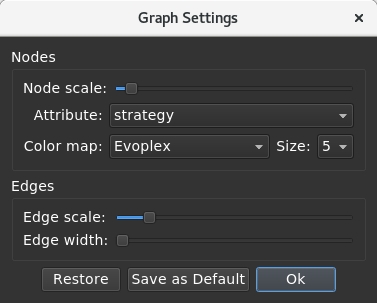
Graph/Grid Settings
The graph/grid views are customizable, i.e., you can choose which attribute to plot, and which colormap to use. Also, it is possible to set the size of the nodes and edges.
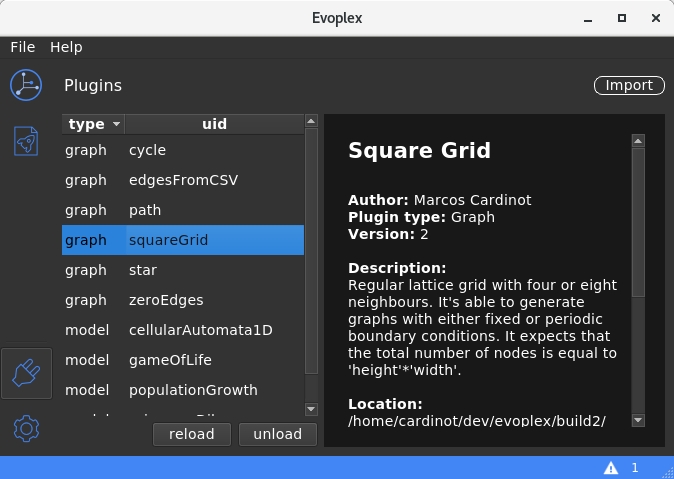
Plugins Page
The plugins page allows loading and unloading Evoplex plugins. The loaded plugins are listed in the table as shown below.
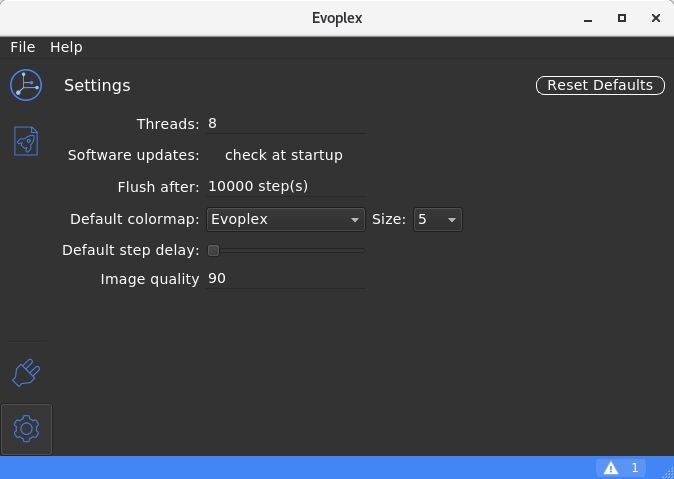
Settings Page